NIFTY50
On Friday, The Nifty50 had a steep gap down opening amid rising expectations for sooner Fed rate hike after inflation jumped to 40-year high, and finally settled with more than a percent loss on February 11, weighed by selling pressure across sectors. The index snapped three-day winning streak and formed bearish candle on the daily charts followed by Hanging Man pattern formation, on Thursday 10th February 2022. During the week, the index corrected 0.8 percent and saw a small bearish candle formation on the weekly scale.
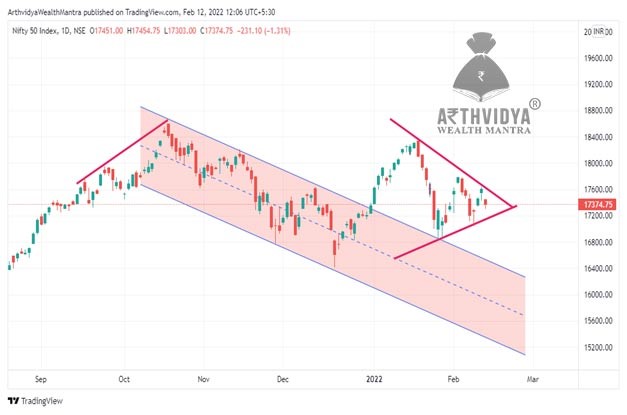
As discussed in last report Nifty 50 is still trading in Symmetrical Triangle(drawn in Image) & the break down or Break out can take Nifty 50 1900 points in either side. On daily Chart Nifty facing resistance at 20 SMA and Middle line of Bollinger band. Last time too it took resistance at 20 SMA.
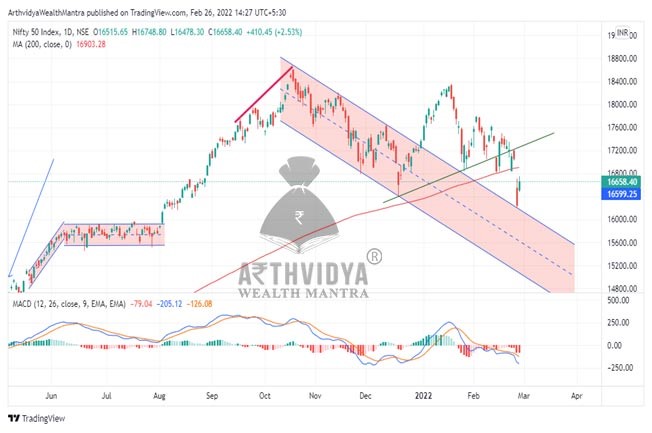
NIFTY DAILY CHART. With Bollinger Band.
Nifty Daily Chart With Drawings.
BANKNIFTY
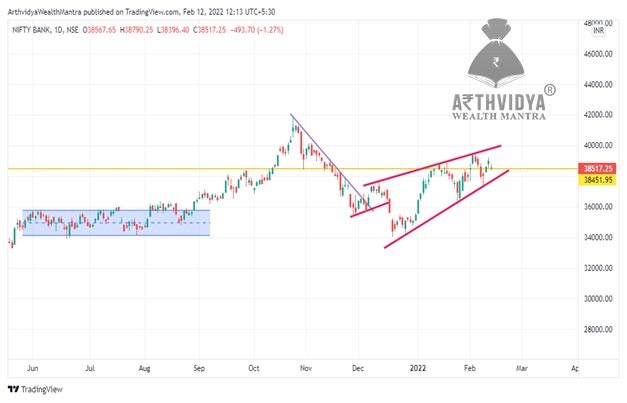
BANK NIFTY On Friday, Bank Nifty opened gap down at 38,567.65 and fell up to around 38,400 levels. However, it witnessed a pullback move near 38,800 but bounces were again being sold. The index formed a Doji sort of candle on daily scale and closed with losses of 493.60 points or 1.27 percent at 38,517.
The index also witnessed Doji kind of pattern formation on the weekly scale and has been moving in a range, falling 0.7 percent for the week. We do expect it to trade in range with positive bias.
On stocks front
Bullish setup was seen in Aurobindo Pharma, Petronet LNG, IOC, InterGlobe Aviation, IndusInd Bank, HPCL, NTPC and ITC.
while weakness was seen in Info Edge, Metropolis Healthcare, Coforge, L&T Infotech, Dr Lal PathLabs, Motherson Sumi, Tata Chemicals, Manappuram Finance, SRF,Lupin ,Balkrishna Industries, Havells, Deepak Nitrite, DLF, Grasim, Jubilant Foodworks, RBL Bank, Godrej Consumer Products, Tech Mahindra and City Union Bank.
Mondays(4th April 2022) Gap Up opening can still Act As support so watch out for 37200 levels for support, below which one can do fresh selling.
Stocks Report :
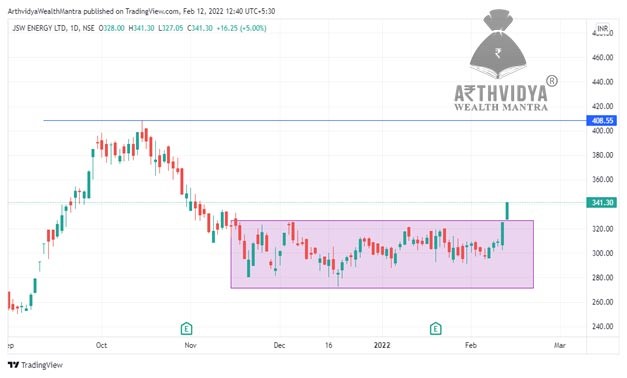
JSW ENERGY LMT – CMP RS 341.30
1. Technically, daily chart suggest that it has give a break out from range and has formed a good bullish candle above all moving averages. .
2. It has break it resistance level of 100 DMA.
3. Momentum indicator RSI and MACD is showing positive cross over indicates strength, as well as BOLLENGER BAND Bounce started, indicating good positive momentum.
4. Its potential target will be its previous high which is 408.
Schneider Electric Infrastructure Limited: CMP Rs 128.35
1. Technically on daily chart stock has given break out and has formed bullish candle by breaking trend line.
2 It is trading above all moving averages.
3. Momentum indicator RSI and MACD is showing positive cross over indicates strength.
4. It has delivered good Q3 result. The company’s net profit rose 57.11% to Rs 52.38 crore on 27.19% rise in net sales to Rs 600.46 crore in Q3 December 2021 over Q3 December 2020.
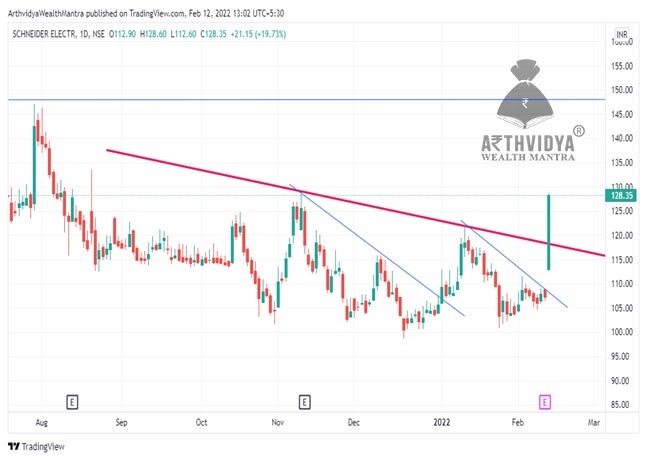
DAILY CHART OF SCHNEIDER ELECTR.
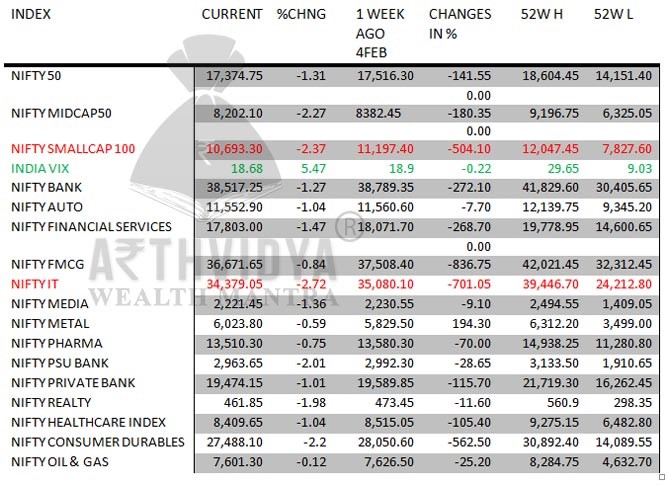
Major indices at a glance :
Majority of the index saw a negative week. The IT index was top loser while rest of the indices also faced rising expectations for sooner Fed rate hike after inflation jumped to 40-year high
Team Arthvidya Wealth Mantra
8484036329 / 79 / 87
www.arthvidya.in / info.arthvidya@gmail.com
Please like our FaceBook Page: https://www.facebook.com/Arthvidya.WealthMantra
Subscribe to our YouTube Channel at :https://studio.youtube.com/channel/UCU4CTekZ6ZAO_y7HNQ9XiYA
Subscribe to our Telegram Channel at:http://t.me/arthvidya"
Disclaimer: This article is intended to be used for information and education
purposes only. It is very important to do your own analysis/study before making any investment decision based on your own personal circumstances. We are in no way related to the companies mentioned and discussed in any of our articles and we are not paid by any of these companies in any way.
Investment/Trading in securities Market is subject to market risk, past performance is not a guarantee of future performance. The risk of loss in trading and investment in Securities markets including Equities, Derivatives, Commodity and Currency can be substantial.