Greetings! As you are aware we have been discussing about the Pharma Sector lately. The largest contributor in the Pharma Index is SUNPHARMA which is a well known company. We will discuss the technical outlook of the stock in detail.

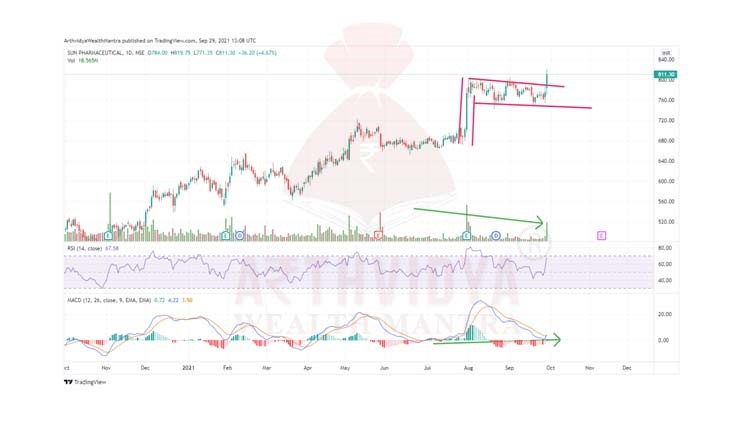
Enclosed is the Daily Chart of the company SunPharma Ltd. We can clearly see a Bullish Flag Pattern in the chart. We can clearly see the breakout on the daily chart supported by sharp growth in volume. As the name suggests the pattern is Bullish. The Flag Pattern is supported by RSI indicator which is on the verge of breaking the crucial levels of 70. This indicates a sharp positive move ahead. The prices can be seen at 850 and subsequently at 890 levels in coming one to two weeks. We can also expect the prices to move upwards in a very short span of time. Further, MACD is rejecting the Zero Line which makes our view even stronger.