.png)
Selan Exploration Technology Limited (SELAN) is a private sector listed company, incorporated in 1985, engaged in oil exploration and production since 1992.
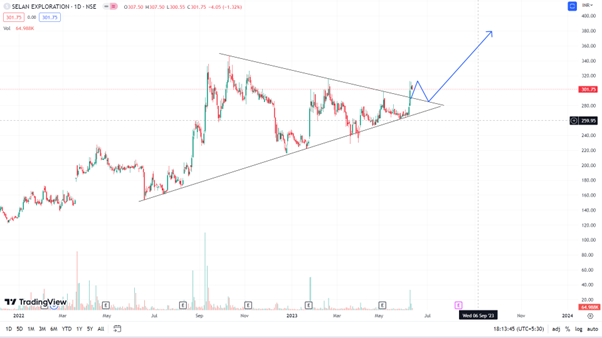
Below is Daily Chart of Selan Exploration. The Candlestick Chart shows formation of Symmetrical Triangle Pattern on a Daily Time Frame.
• The Stock Prices have given breakout on upside on 9th June 2023 from the pattern with good volume surge.
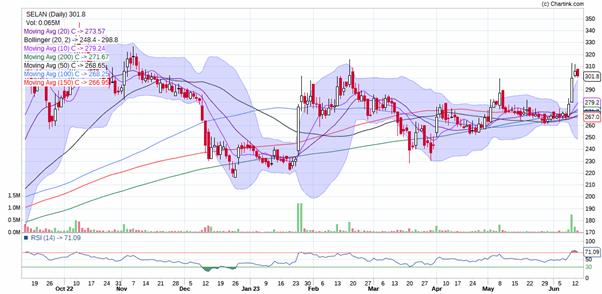
• Relative Strength Index (RSI) at the time of writing this article is at 71.09 levels suggesting strength in the stock.
Price target of breakout comes at 485.
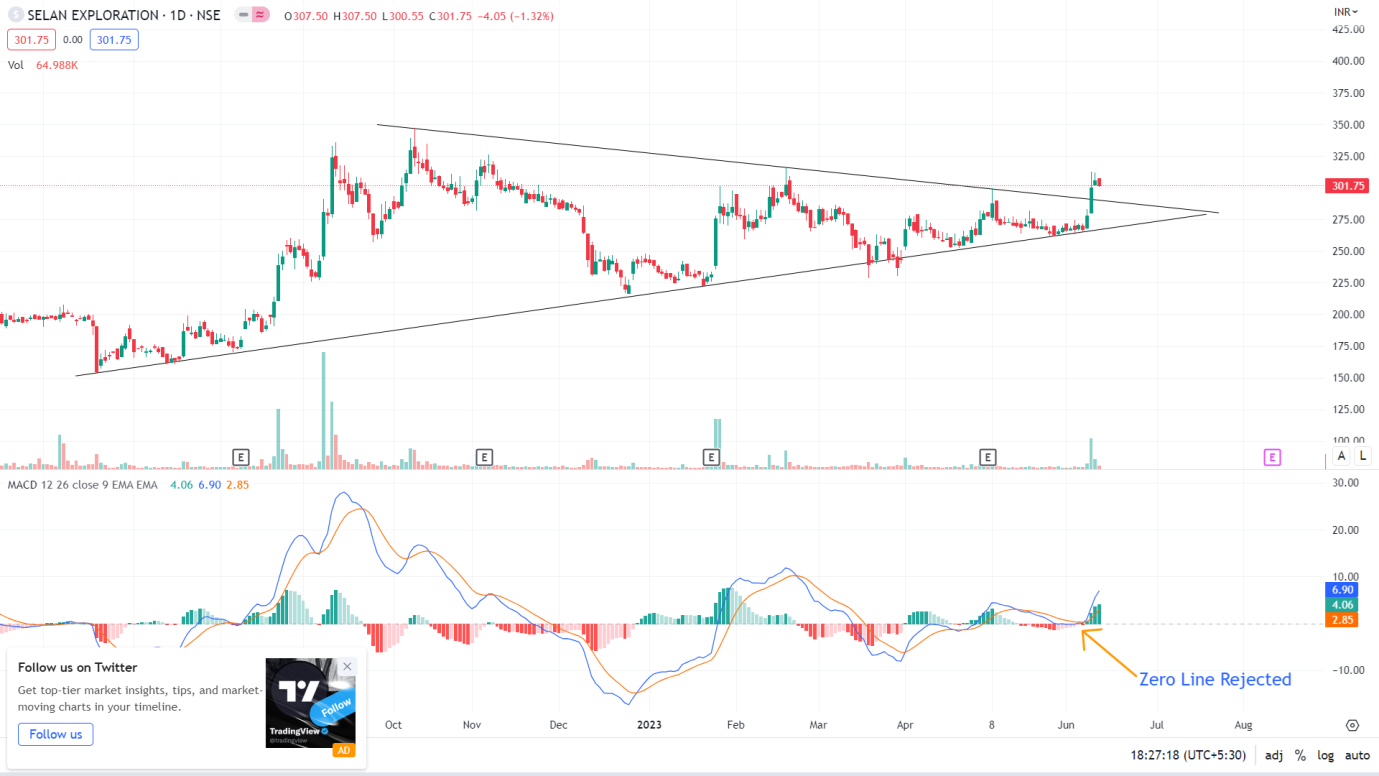
• MACD has given zero-line rejection which is a very good bullish indication. Refer fig 02
• The share prices are trading above all Short Term & Long Term moving averages i.e. SMA10, SMA20, SMS50, SMA100, SMA150 and
SMA200.
• All moving averages have converged with each other forming (a very popular) Sangam Pattern Buy position.
• Bollinger Band is showing a bounce, suggesting good up move to follow soon.
Considering all the above pointers we think the stock will show a positive direction and hit Rs. 485 per share within coming 4 to 5 months.